
Happy new year, let’s talk about death. This instalment is about mortality and how it varies with season. The ONS reports daily mortality figures, combined here for England and Wales, between 1970 and 2014 (current population 57.8 million) are shown below.
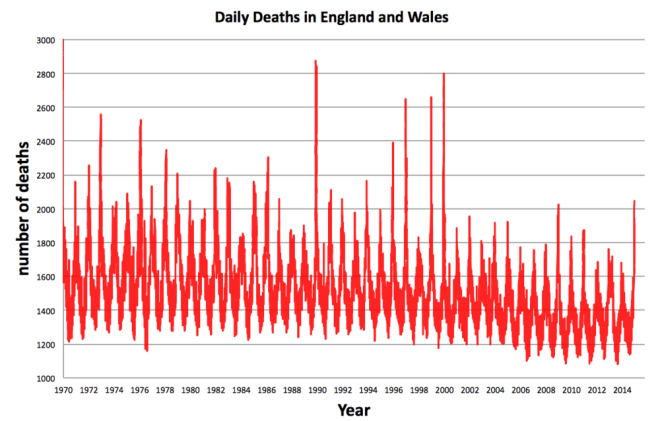 Each one of the 25 million deaths in England and Wales between 1970 and 2014. Source: ONS
The first thing that’s striking about this chart is its seasonal variability. Broadly speaking the number of daily deaths oscillates between 1000 and 3000 deaths per day, peaking in the winter months. Over time there is a reduction in the average daily death rate; In 1970 the population of England and Wales was under 50 million, and yet more people died every day, which is consistent with an increase in life expectancy in recent years.
However, this doesn’t tell us much about why people die, and what the seasonal variation means. The extent to which more people die in winter than summer is encoded in the excess winter mortality (EWM) figures. These record how many more people die in winter than summer. Not all causes of death are seasonally effected, but the majority of EWM is caused by respiratory diseases (including flu), cerebrovascular disease, heart disease, and dementia. It’s rare that people die of direct exposure to cold in the UK, though it does happen. Typically, older people are at a greater risk of winter diseases, although, sometimes, certain strains of flu effect the young more than the old.
The impact of cold housing on EWM is discussed in the Marmot Review. The authors found that “in the coldest quarter of housing, [EWM] is almost three times higher as in the warmest quarter”. The UK does not compare well to Europe. Even though the winter is colder in countries such as Finland, the EWM figures are lower.
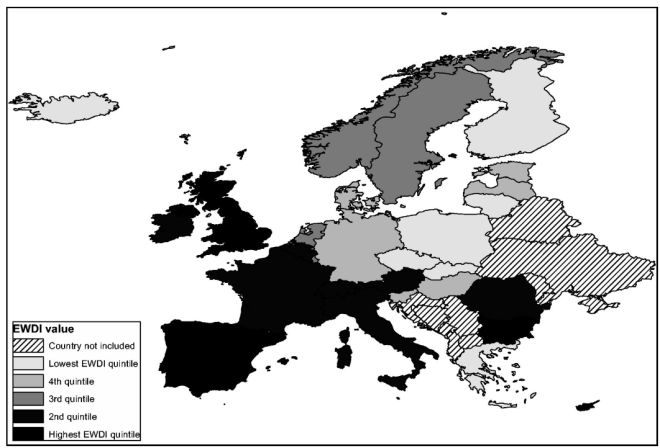 Excess winter deaths over 9 years in Europe. Source: Excess Winter Deaths in Europe: a multi-country descriptive analysis. Source
Why should we care about mortality statistics? In a 1990 article “life and death”, Amartya Sen wrote of their importance as means of measuring society, as a window on inequality and a measure of wellbeing. Sen was specifically looking at instances of famine in developing countries, as well as gender and racial inequality; a similar approach reveals that suicide is the leading cause of death among people aged 20-34 in the UK, for example. The impact of winter in the UK, and how the state of housing relates to it, is reflected in the numbers. But with all things, stats are just one side of the story, the lived experience of people enduring cold homes and poverty is also a vital part of the story.
Further reading
Interesting graphs on excess winter mortality here
An incredible database of all causes of death recorded by the WHO is here
The failure to reduce the suicide rate among young men is discussed here
Living in fuel poverty, videos are here
Finally, an amazing video of Amartya Sen speaking at a City Council meeting in Cambridge MA regarding the application for an additional curb cut near his home. Nobel prize winning economist meets local politics…
